4
Dave Bourgeois and David T. Bourgeois
Learning Objectives
Upon successful completion of this chapter, you will be able to:
- describe the differences between data, information, and knowledge;
- define the term database and identify the steps to creating one;
- describe the role of a database management system;
- describe the characteristics of a data warehouse; and
- define data mining and describe its role in an organization.
Please note, there is an updated edition of this book available at https://opentextbook.site. If you are not required to use this edition for a course, you may want to check it out.
Introduction
You have already been introduced to the first two components of information systems: hardware and software. However, those two components by themselves do not make a computer useful. Imagine if you turned on a computer, started the word processor, but could not save a document. Imagine if you opened a music player but there was no music to play. Imagine opening a web browser but there were no web pages. Without data, hardware and software are not very useful! Data is the third component of an information system.
Data, Information, and Knowledge
Data are the raw bits and pieces of information with no context. If I told you, “15, 23, 14, 85,” you would not have learned anything. But I would have given you data.
Data can be quantitative or qualitative. Quantitative data is numeric, the result of a measurement, count, or some other mathematical calculation. Qualitative data is descriptive. “Ruby Red,” the color of a 2013 Ford Focus, is an example of qualitative data. A number can be qualitative too: if I tell you my favorite number is 5, that is qualitative data because it is descriptive, not the result of a measurement or mathematical calculation.
 By itself, data is not that useful. To be useful, it needs to be given context. Returning to the example above, if I told you that “15, 23, 14, and 85″ are the numbers of students that had registered for upcoming classes, that would be information. By adding the context – that the numbers represent the count of students registering for specific classes – I have converted data into information.
Once we have put our data into context, aggregated and analyzed it, we can use it to make decisions for our organization. We can say that this consumption of information produces knowledge. This knowledge can be used to make decisions, set policies, and even spark innovation.
The final step up the information ladder is the step from knowledge (knowing a lot about a topic) to wisdom. We can say that someone has wisdom when they can combine their knowledge and experience to produce a deeper understanding of a topic. It often takes many years to develop wisdom on a particular topic, and requires patience.
Examples of Data
Almost all software programs require data to do anything useful. For example, if you are editing a document in a word processor such as Microsoft Word, the document you are working on is the data. The word-processing software can manipulate the data: create a new document, duplicate a document, or modify a document. Some other examples of data are: an MP3 music file, a video file, a spreadsheet, a web page, and an e-book. In some cases, such as with an e-book, you may only have the ability to read the data.
Databases
The goal of many information systems is to transform data into information in order to generate knowledge that can be used for decision making. In order to do this, the system must be able to take data, put the data into context, and provide tools for aggregation and analysis. A database is designed for just such a purpose.
A database is an organized collection of related information. It is an organized collection, because in a database, all data is described and associated with other data. All information in a database should be related as well; separate databases should be created to manage unrelated information. For example, a database that contains information about students should not also hold information about company stock prices. Databases are not always digital – a filing cabinet, for instance, might be considered a form of database. For the purposes of this text, we will only consider digital databases.
Relational Databases
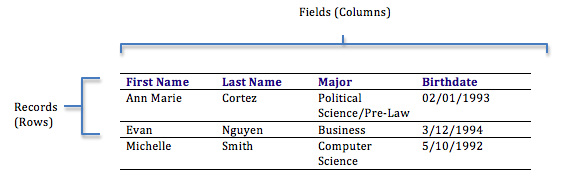
Databases can be organized in many different ways, and thus take many forms. The most popular form of database today is the relational database. Popular examples of relational databases are Microsoft Access, MySQL, and Oracle. A relational database is one in which data is organized into one or more tables. Each table has a set of fields, which define the nature of the data stored in the table. A record is one instance of a set of fields in a table. To visualize this, think of the records as the rows of the table and the fields as the columns of the table. In the example below, we have a table of student information, with each row representing a student and each column representing one piece of information about the student.
In a relational database, all the tables are related by one or more fields, so that it is possible to connect all the tables in the database through the field(s) they have in common. For each table, one of the fields is identified as a primary key. This key is the unique identifier for each record in the table. To help you understand these terms further, let’s walk through the process of designing a database.
Designing a Database
Suppose a university wants to create an information system to track participation in student clubs. After interviewing several people, the design team learns that the goal of implementing the system is to give better insight into how the university funds clubs. This will be accomplished by tracking how many members each club has and how active the clubs are. From this, the team decides that the system must keep track of the clubs, their members, and their events. Using this information, the design team determines that the following tables need to be created:
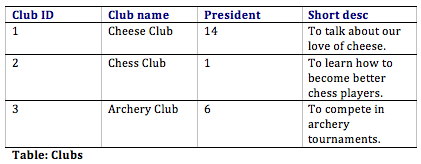
- Clubs: this will track the club name, the club president, and a short description of the club.
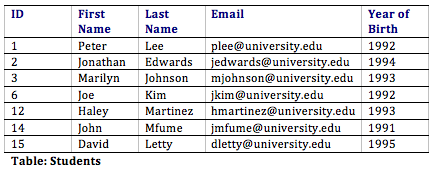
- Students: student name, e-mail, and year of birth.
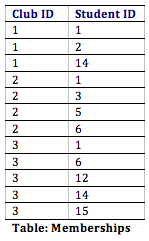
- Memberships: this table will correlate students with clubs, allowing us to have any given student join multiple clubs.
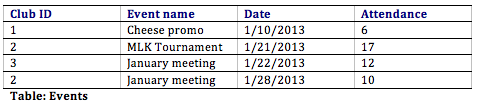
- Events: this table will track when the clubs meet and how many students showed up.
Now that the design team has determined which tables to create, they need to define the specific information that each table will hold. This requires identifying the fields that will be in each table. For example, Club Name would be one of the fields in the Clubs table. First Name and Last Name would be fields in the Students table. Finally, since this will be a relational database, every table should have a field in common with at least one other table (in other words: they should have a relationship with each other).
In order to properly create this relationship, a primary key must be selected for each table. This key is a unique identifier for each record in the table. For example, in the Students table, it might be possible to use students’ last name as a way to uniquely identify them. However, it is more than likely that some students will share a last name (like Rodriguez, Smith, or Lee), so a different field should be selected. A student’s e-mail address might be a good choice for a primary key, since e-mail addresses are unique. However, a primary key cannot change, so this would mean that if students changed their e-mail address we would have to remove them from the database and then re-insert them – not an attractive proposition. Our solution is to create a value for each student — a user ID — that will act as a primary key. We will also do this for each of the student clubs. This solution is quite common and is the reason you have so many user IDs!
You can see the final database design in the figure below:

With this design, not only do we have a way to organize all of the information we need to meet the requirements, but we have also successfully related all the tables together. Here’s what the database tables might look like with some sample data. Note that the Memberships table has the sole purpose of allowing us to relate multiple students to multiple clubs.
Normalization
When designing a database, one important concept to understand is normalization. In simple terms, to normalize a database means to design it in a way that: 1) reduces duplication of data between tables and 2) gives the table as much flexibility as possible.
In the Student Clubs database design, the design team worked to achieve these objectives. For example, to track memberships, a simple solution might have been to create a Members field in the Clubs table and then just list the names of all of the members there. However, this design would mean that if a student joined two clubs, then his or her information would have to be entered a second time. Instead, the designers solved this problem by using two tables: Students and Memberships.
In this design, when a student joins their first club, we first must add the student to the Students table, where their first name, last name, e-mail address, and birth year are entered. This addition to the Students table will generate a student ID. Now we will add a new entry to denote that the student is a member of a specific club. This is accomplished by adding a record with the student ID and the club ID in the Memberships table. If this student joins a second club, we do not have to duplicate the entry of the student’s name, e-mail, and birth year; instead, we only need to make another entry in the Memberships table of the second club’s ID and the student’s ID.
The design of the Student Clubs database also makes it simple to change the design without major modifications to the existing structure. For example, if the design team were asked to add functionality to the system to track faculty advisors to the clubs, we could easily accomplish this by adding a Faculty Advisors table (similar to the Students table) and then adding a new field to the Clubs table to hold the Faculty Advisor ID.
Data Types
When defining the fields in a database table, we must give each field a data type. For example, the field Birth Year is a year, so it will be a number, while First Name will be text. Most modern databases allow for several different data types to be stored. Some of the more common data types are listed here:
- Text: for storing non-numeric data that is brief, generally under 256 characters. The database designer can identify the maximum length of the text.
- Number: for storing numbers. There are usually a few different number types that can be selected, depending on how large the largest number will be.
- Yes/No: a special form of the number data type that is (usually) one byte long, with a 0 for “No” or “False” and a 1 for “Yes” or “True”.
- Date/Time: a special form of the number data type that can be interpreted as a number or a time.
- Currency: a special form of the number data type that formats all values with a currency indicator and two decimal places.
- Paragraph Text: this data type allows for text longer than 256 characters.
- Object: this data type allows for the storage of data that cannot be entered via keyboard, such as an image or a music file.
There are two important reasons that we must properly define the data type of a field. First, a data type tells the database what functions can be performed with the data. For example, if we wish to perform mathematical functions with one of the fields, we must be sure to tell the database that the field is a number data type. So if we have, say, a field storing birth year, we can subtract the number stored in that field from the current year to get age.
The second important reason to define data type is so that the proper amount of storage space is allocated for our data. For example, if the First Name field is defined as a text(50) data type, this means fifty characters are allocated for each first name we want to store. However, even if the first name is only five characters long, fifty characters (bytes) will be allocated. While this may not seem like a big deal, if our table ends up holding 50,000 names, we are allocating 50 * 50,000 = 2,500,000 bytes for storage of these values. It may be prudent to reduce the size of the field so we do not waste storage space.
Sidebar: The Difference between a Database and a Spreadsheet
Many times, when introducing the concept of databases to students, they quickly decide that a database is pretty much the same as a spreadsheet. After all, a spreadsheet stores data in an organized fashion, using rows and columns, and looks very similar to a database table. This misunderstanding extends beyond the classroom: spreadsheets are used as a substitute for databases in all types of situations every day, all over the world.
To be fair, for simple uses, a spreadsheet can substitute for a database quite well. If a simple listing of rows and columns (a single table) is all that is needed, then creating a database is probably overkill. In our Student Clubs example, if we only needed to track a listing of clubs, the number of members, and the contact information for the president, we could get away with a single spreadsheet. However, the need to include a listing of events and the names of members would be problematic if tracked with a spreadsheet.
When several types of data must be mixed together, or when the relationships between these types of data are complex, then a spreadsheet is not the best solution. A database allows data from several entities (such as students, clubs, memberships, and events) to all be related together into one whole. While a spreadsheet does allow you to define what kinds of values can be entered into its cells, a database provides more intuitive and powerful ways to define the types of data that go into each field, reducing possible errors and allowing for easier analysis.
Though not good for replacing databases, spreadsheets can be ideal tools for analyzing the data stored in a database. A spreadsheet package can be connected to a specific table or query in a database and used to create charts or perform analysis on that data.
Structured Query Language
Once you have a database designed and loaded with data, how will you do something useful with it? The primary way to work with a relational database is to use Structured Query Language, SQL (pronounced “sequel,” or simply stated as S-Q-L). Almost all applications that work with databases (such as database management systems, discussed below) make use of SQL as a way to analyze and manipulate relational data. As its name implies, SQL is a language that can be used to work with a relational database. From a simple request for data to a complex update operation, SQL is a mainstay of programmers and database administrators. To give you a taste of what SQL might look like, here are a couple of examples using our Student Clubs database.
- The following query will retrieve a list of the first and last names of the club presidents:
SELECT "First Name", "Last Name" FROM "Students" WHERE "Students.ID" = "Clubs.President"
- The following query will create a list of the number of students in each club, listing the club name and then the number of members:
SELECT "Clubs.Club Name", COUNT("Memberships.Student ID") FROM "Clubs" LEFT JOIN "Memberships" ON "Clubs.Club ID" = "Memberships.Club ID"
An in-depth description of how SQL works is beyond the scope of this introductory text, but these examples should give you an idea of the power of using SQL to manipulate relational data. Many database packages, such as Microsoft Access, allow you to visually create the query you want to construct and then generate the SQL query for you.
Other Types of Databases
The relational database model is the most used database model today. However, many other database models exist that provide different strengths than the relational model. The hierarchical database model, popular in the 1960s and 1970s, connected data together in a hierarchy, allowing for a parent/child relationship between data. The document-centric model allowed for a more unstructured data storage by placing data into “documents” that could then be manipulated.
Perhaps the most interesting new development is the concept of NoSQL (from the phrase “not only SQL”). NoSQL arose from the need to solve the problem of large-scale databases spread over several servers or even across the world. For a relational database to work properly, it is important that only one person be able to manipulate a piece of data at a time, a concept known as record-locking. But with today’s large-scale databases (think Google and Amazon), this is just not possible. A NoSQL database can work with data in a looser way, allowing for a more unstructured environment, communicating changes to the data over time to all the servers that are part of the database.
Database Management Systems
To the computer, a database looks like one or more files. In order for the data in the database to be read, changed, added, or removed, a software program must access it. Many software applications have this ability: iTunes can read its database to give you a listing of its songs (and play the songs); your mobile-phone software can interact with your list of contacts. But what about applications to create or manage a database? What software can you use to create a database, change a database’s structure, or simply do analysis? That is the purpose of a category of software applications called database management systems (DBMS).
DBMS packages generally provide an interface to view and change the design of the database, create queries, and develop reports. Most of these packages are designed to work with a specific type of database, but generally are compatible with a wide range of databases.
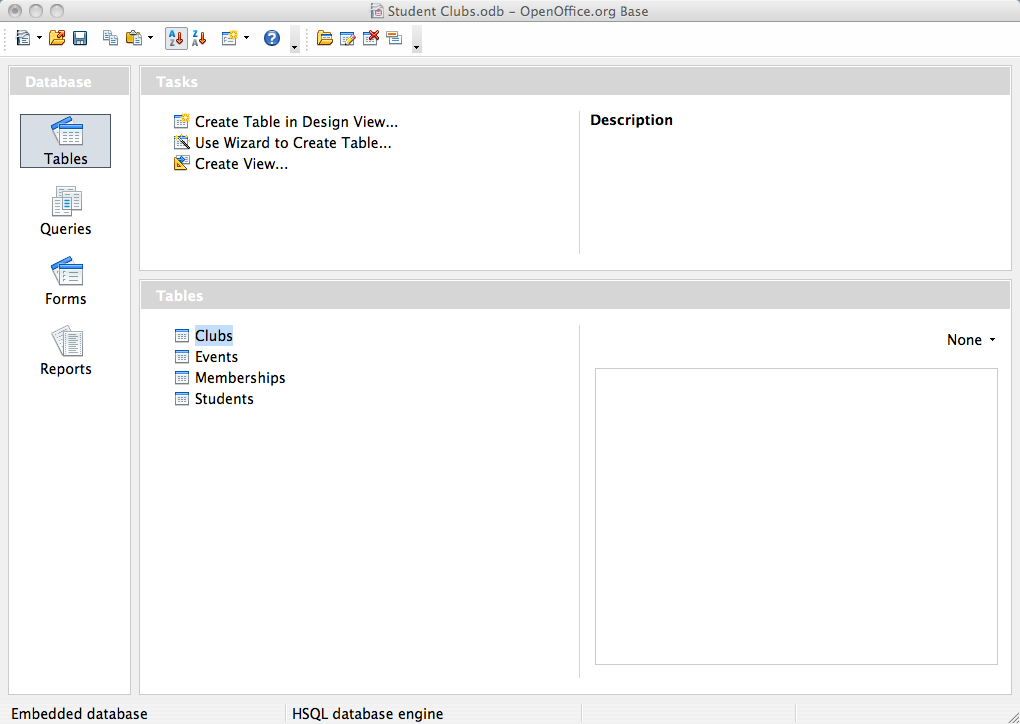
For example, Apache OpenOffice.org Base (see screen shot) can be used to create, modify, and analyze databases in open-database (ODB) format. Microsoft’s Access DBMS is used to work with databases in its own Microsoft Access Database format. Both Access and Base have the ability to read and write to other database formats as well.
Microsoft Access and Open Office Base are examples of personal database-management systems. These systems are primarily used to develop and analyze single-user databases. These databases are not meant to be shared across a network or the Internet, but are instead installed on a particular device and work with a single user at a time.
Enterprise Databases
A database that can only be used by a single user at a time is not going to meet the needs of most organizations. As computers have become networked and are now joined worldwide via the Internet, a class of database has emerged that can be accessed by two, ten, or even a million people. These databases are sometimes installed on a single computer to be accessed by a group of people at a single location. Other times, they are installed over several servers worldwide, meant to be accessed by millions. These relational enterprise database packages are built and supported by companies such as Oracle, Microsoft, and IBM. The open-source MySQL is also an enterprise database.
As stated earlier, the relational database model does not scale well. The term scale here refers to a database getting larger and larger, being distributed on a larger number of computers connected via a network. Some companies are looking to provide large-scale database solutions by moving away from the relational model to other, more flexible models. For example, Google now offers the App Engine Datastore, which is based on NoSQL. Developers can use the App Engine Datastore to develop applications that access data from anywhere in the world. Amazon.com offers several database services for enterprise use, including Amazon RDS, which is a relational database service, and Amazon DynamoDB, a NoSQL enterprise solution.
Big Data
A new buzzword that has been capturing the attention of businesses lately is big data. The term refers to such massively large data sets that conventional database tools do not have the processing power to analyze them. For example, Walmart must process over one million customer transactions every hour. Storing and analyzing that much data is beyond the power of traditional database-management tools. Understanding the best tools and techniques to manage and analyze these large data sets is a problem that governments and businesses alike are trying to solve.
Sidebar: What Is Metadata?
The term metadata can be understood as “data about data.” For example, when looking at one of the values of Year of Birth in the Students table, the data itself may be “1992”. The metadata about that value would be the field name Year of Birth, the time it was last updated, and the data type (integer). Another example of metadata could be for an MP3 music file, like the one shown in the image below; information such as the length of the song, the artist, the album, the file size, and even the album cover art, are classified as metadata. When a database is being designed, a “data dictionary” is created to hold the metadata, defining the fields and structure of the database.
-
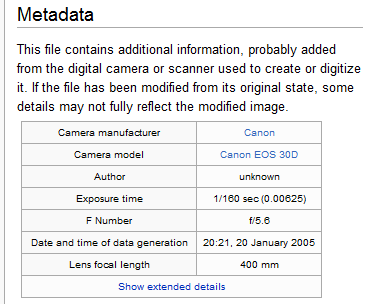
Metadata about a camera image (Public Domain)

Data Warehouse
As organizations have begun to utilize databases as the centerpiece of their operations, the need to fully understand and leverage the data they are collecting has become more and more apparent. However, directly analyzing the data that is needed for day-to-day operations is not a good idea; we do not want to tax the operations of the company more than we need to. Further, organizations also want to analyze data in a historical sense: How does the data we have today compare with the same set of data this time last month, or last year? From these needs arose the concept of the data warehouse.
The concept of the data warehouse is simple: extract data from one or more of the organization’s databases and load it into the data warehouse (which is itself another database) for storage and analysis. However, the execution of this concept is not that simple. A data warehouse should be designed so that it meets the following criteria:
- It uses non-operational data. This means that the data warehouse is using a copy of data from the active databases that the company uses in its day-to-day operations, so the data warehouse must pull data from the existing databases on a regular, scheduled basis.
- The data is time-variant. This means that whenever data is loaded into the data warehouse, it receives a time stamp, which allows for comparisons between different time periods.
- The data is standardized. Because the data in a data warehouse usually comes from several different sources, it is possible that the data does not use the same definitions or units. For example, our Events table in our Student Clubs database lists the event dates using the mm/dd/yyyy format (e.g., 01/10/2013). A table in another database might use the format yy/mm/dd (e.g., 13/01/10) for dates. In order for the data warehouse to match up dates, a standard date format would have to be agreed upon and all data loaded into the data warehouse would have to be converted to use this standard format. This process is called extraction-transformation-load (ETL).
There are two primary schools of thought when designing a data warehouse: bottom-up and top-down. The bottom-up approach starts by creating small data warehouses, called data marts, to solve specific business problems. As these data marts are created, they can be combined into a larger data warehouse. The top-down approach suggests that we should start by creating an enterprise-wide data warehouse and then, as specific business needs are identified, create smaller data marts from the data warehouse.

Benefits of Data Warehouses
Organizations find data warehouses quite beneficial for a number of reasons:
- The process of developing a data warehouse forces an organization to better understand the data that it is currently collecting and, equally important, what data is not being collected.
- A data warehouse provides a centralized view of all data being collected across the enterprise and provides a means for determining data that is inconsistent.
- Once all data is identified as consistent, an organization can generate one version of the truth. This is important when the company wants to report consistent statistics about itself, such as revenue or number of employees.
- By having a data warehouse, snapshots of data can be taken over time. This creates a historical record of data, which allows for an analysis of trends.
- A data warehouse provides tools to combine data, which can provide new information and analysis.
Data Mining
Data mining is the process of analyzing data to find previously unknown trends, patterns, and associations in order to make decisions. Generally, data mining is accomplished through automated means against extremely large data sets, such as a data warehouse. Some examples of data mining include:
- An analysis of sales from a large grocery chain might determine that milk is purchased more frequently the day after it rains in cities with a population of less than 50,000.
- A bank may find that loan applicants whose bank accounts show particular deposit and withdrawal patterns are not good credit risks.
- A baseball team may find that collegiate baseball players with specific statistics in hitting, pitching, and fielding make for more successful major league players.
In some cases, a data-mining project is begun with a hypothetical result in mind. For example, a grocery chain may already have some idea that buying patterns change after it rains and want to get a deeper understanding of exactly what is happening. In other cases, there are no presuppositions and a data-mining program is run against large data sets in order to find patterns and associations.
Privacy Concerns
The increasing power of data mining has caused concerns for many, especially in the area of privacy. In today’s digital world, it is becoming easier than ever to take data from disparate sources and combine them to do new forms of analysis. In fact, a whole industry has sprung up around this technology: data brokers. These firms combine publicly accessible data with information obtained from the government and other sources to create vast warehouses of data about people and companies that they can then sell. This subject will be covered in much more detail in chapter 12 – the chapter on the ethical concerns of information systems.
Business Intelligence and Business Analytics
With tools such as data warehousing and data mining at their disposal, businesses are learning how to use information to their advantage. The term business intelligence is used to describe the process that organizations use to take data they are collecting and analyze it in the hopes of obtaining a competitive advantage. Besides using data from their internal databases, firms often purchase information from data brokers to get a big-picture understanding of their industries. Business analytics is the term used to describe the use of internal company data to improve business processes and practices.
Knowledge Management
We end the chapter with a discussion on the concept of knowledge management (KM). All companies accumulate knowledge over the course of their existence. Some of this knowledge is written down or saved, but not in an organized fashion. Much of this knowledge is not written down; instead, it is stored inside the heads of its employees. Knowledge management is the process of formalizing the capture, indexing, and storing of the company’s knowledge in order to benefit from the experiences and insights that the company has captured during its existence.
Summary
In this chapter, we learned about the role that data and databases play in the context of information systems. Data is made up of small facts and information without context. If you give data context, then you have information. Knowledge is gained when information is consumed and used for decision making. A database is an organized collection of related information. Relational databases are the most widely used type of database, where data is structured into tables and all tables must be related to each other through unique identifiers. A database management system (DBMS) is a software application that is used to create and manage databases, and can take the form of a personal DBMS, used by one person, or an enterprise DBMS that can be used by multiple users. A data warehouse is a special form of database that takes data from other databases in an enterprise and organizes it for analysis. Data mining is the process of looking for patterns and relationships in large data sets. Many businesses use databases, data warehouses, and data-mining techniques in order to produce business intelligence and gain a competitive advantage.
Study Questions
- What is the difference between data, information, and knowledge?
- Explain in your own words how the data component relates to the hardware and software components of information systems.
- What is the difference between quantitative data and qualitative data? In what situations could the number 42 be considered qualitative data?
- What are the characteristics of a relational database?
- When would using a personal DBMS make sense?
- What is the difference between a spreadsheet and a database? List three differences between them.
- Describe what the term normalization means.
- Why is it important to define the data type of a field when designing a relational database?
- Name a database you interact with frequently. What would some of the field names be?
- What is metadata?
- Name three advantages of using a data warehouse.
- What is data mining?
Exercises
- Review the design of the Student Clubs database earlier in this chapter. Reviewing the lists of data types given, what data types would you assign to each of the fields in each of the tables. What lengths would you assign to the text fields?
- Download Apache OpenOffice.org and use the database tool to open the “Student Clubs.odb” file available here. Take some time to learn how to modify the database structure and then see if you can add the required items to support the tracking of faculty advisors, as described at the end of the Normalization section in the chapter. Here is a link to the Getting Started documentation.
- Using Microsoft Access, download the database file of comprehensive baseball statistics from the website SeanLahman.com. (If you don’t have Microsoft Access, you can download an abridged version of the file here that is compatible with Apache Open Office). Review the structure of the tables included in the database. Come up with three different data-mining experiments you would like to try, and explain which fields in which tables would have to be analyzed.
- Do some original research and find two examples of data mining. Summarize each example and then write about what the two examples have in common.
- Conduct some independent research on the process of business intelligence. Using at least two scholarly or practitioner sources, write a two-page paper giving examples of how business intelligence is being used.
- Conduct some independent research on the latest technologies being used for knowledge management. Using at least two scholarly or practitioner sources, write a two-page paper giving examples of software applications or new technologies being used in this field.
